
The Role of Analytics in Newsletter Campaigns

Most marketers running newsletter campaigns can tell you their open rate without hesitation. Far fewer can tell you how that open rate connects to revenue, retention, or actual audience behavior. The role of analytics in newsletter campaigns goes much deeper than tracking opens and clicks. When you treat those two numbers as success indicators, you miss what your audience is actually doing, and more importantly, what they are likely to do next. This guide walks you through the metrics that matter, the analytics approaches that link campaign data to real business outcomes, and the reporting practices that make your strategy sharper over time.
Table of Contents
Key takeaways
Point | Details |
Opens and clicks are not enough | Surface metrics miss downstream behaviors like conversions, retention, and revenue impact. |
Connect metrics to outcomes | Linking campaign data to CLV and churn probability reveals real financial impact. |
Post-click behavior matters | Tracking repeat visits and topic affinity predicts subscriber value more accurately than initial clicks. |
UTM consistency is non-negotiable | Standardized UTM naming keeps your attribution data clean and reliable across all platforms. |
Reporting should be ongoing | Treating analytics as a continuous process, not a one-time audit, drives compounding campaign improvements. |
The role of analytics in newsletter campaigns
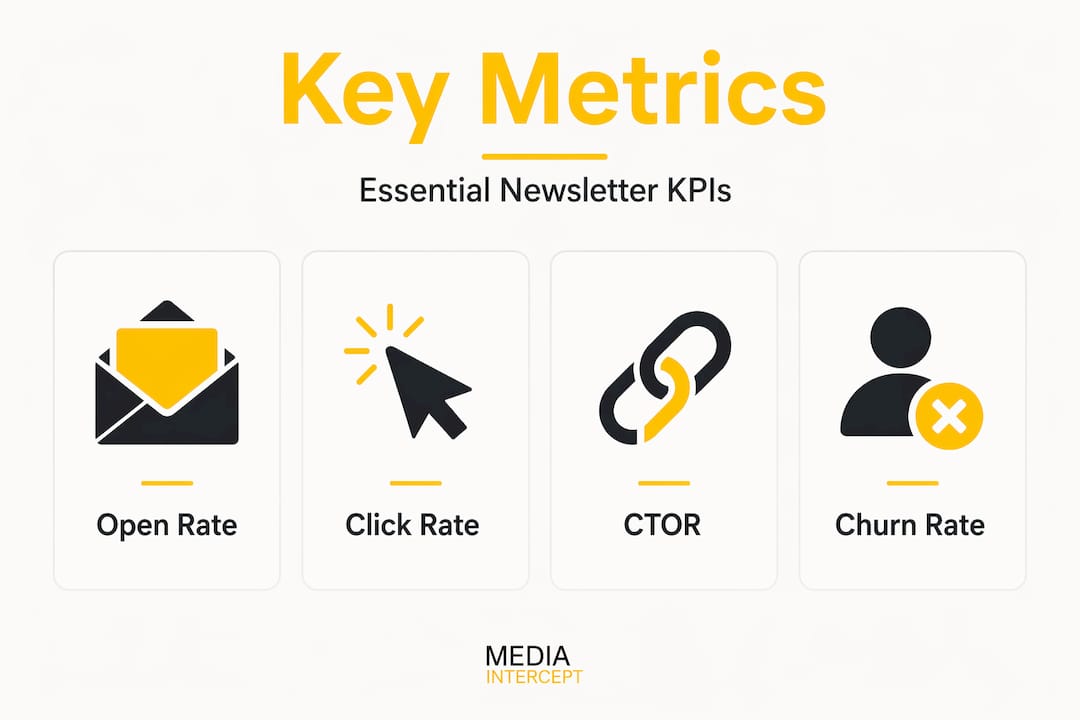
Open rate and click-through rate (CTR) have long been the default metrics for measuring newsletter performance. They are easy to find and easy to report. The problem is that they are leading indicators, not outcome indicators. Fourteen essential email metrics include not just open and click rates but also click-to-open rate (CTOR), bounce rate, unsubscribe rate, landing page conversion rate, and email-driven revenue. Each one captures a different dimension of how your campaign is actually performing.
Here is what a complete set of core metrics looks like across three categories:
Engagement metrics:
Open rate: the percentage of delivered emails that were opened
Click-through rate (CTR): the percentage of delivered emails that generated at least one click
Click-to-open rate (CTOR): clicks divided by opens, which isolates content relevance from subject line performance
Deliverability metrics:
Bounce rate: hard and soft bounces signaling list health issues
Spam complaint rate: a direct signal of audience trust and list quality
Unsubscribe rate: best tracked as a trend over time, not as a single data point
Downstream metrics:
Landing page conversion rate: what subscribers do after clicking through
Email-driven revenue: actual purchase activity attributed to a specific send
Average order value (AOV): the average dollar amount of purchases driven by your campaign
One distinction worth understanding is the difference between unique clicks and total clicks. Total clicks reflect re-engagement, meaning a subscriber who clicks the same link three times counts three times. Unique clicks count that subscriber once, giving you a more accurate read on how many people in your audience actually engaged. Confusing these two will lead you to overestimate your reach.
Pro Tip: Track CTOR alongside CTR. If your CTR drops but CTOR stays steady, the problem is your subject line or preview text, not your content. That is a completely different fix.
Connecting newsletter data to business outcomes
Tracking standard metrics is table stakes. The real lift in analytics in newsletter marketing comes from connecting those numbers to what your business actually cares about. Marketing analytics uses cross-channel, people-centered data to link newsletter activity directly to leads, customers, and revenue. That is fundamentally different from web analytics, which tracks sessions and page views without knowing who the person behind the behavior is.
Here are the concepts that separate advanced analytics from basic reporting:
Customer lifetime value (CLV): How much revenue a subscriber is likely to generate over their entire relationship with your brand. Predictive analytics can forecast CLV using machine learning models that weigh purchase history, engagement frequency, and category affinity.
Churn probability: The likelihood a subscriber will disengage or unsubscribe within a defined window. Campaigns targeted at high-churn-risk segments perform very differently than broad sends.
Repeat purchase rate: Among subscribers who converted once, how many came back? This metric ties newsletter retention directly to revenue behavior.
Closed-loop reporting is what makes all of this possible. Integrating email platforms, CRM, and ecommerce data creates a single view of how a subscriber moves from open to click to purchase to repeat customer. Without that integration, you are working with fragments of a picture.
Most newsletter dashboards under-explain attribution mismatch. Analyzing patterns over 90 days provides far more accurate revenue attribution than a single campaign dashboard ever will.
Segmentation is the practical output of this kind of analytics. When you know which subscribers have high CLV and low churn probability, you can prioritize them with different content, frequency, or offers. That is what data-driven newsletter strategies actually look like at the execution level.
Measuring post-click behavior and long-term engagement
Getting a click is one thing. Understanding what that click means for long-term subscriber value is something else entirely. Tracking downstream behaviors beyond opens and clicks is what separates marketers who grow audiences from those who simply maintain lists. Here is how you build that picture:
Repeat visit rate: How often does a subscriber return to content they first accessed through your newsletter? High repeat visit rates signal that your content is genuinely useful, not just clickable.
Return-to-open rate: Among subscribers who opened your last campaign, how many opened this one too? This is a cohort retention metric disguised as an engagement metric.
Link re-engagement: Which specific links in past sends continue to drive traffic after the initial send window? Those links tell you what your audience actually values, separate from what made them click in the moment.
Topic affinity: Grouping subscriber behavior by content categories reveals what subjects drive the most sustained engagement. Post-click engagement reveals true content effectiveness and helps you optimize for audience retention rather than one-time traffic spikes.
Using content cluster analytics, you can map which topics create habitual engagement. A subscriber who consistently clicks your industry news roundup but ignores your product content has a very different profile than one who only clicks promotional links. Treating both the same way in future sends is a strategic mistake.
Cohort analysis is the most practical tool for reducing churn. When you group subscribers by the month they joined and track their engagement over time, you see exactly when audiences disengage. Most newsletter marketers discover that churn is not evenly distributed. It spikes at predictable windows, often around the 30-day and 90-day marks, and that knowledge lets you build specific reactivation campaigns before subscribers go cold.

Pro Tip: Build a “content affinity score” by tagging every link in your newsletter by topic and tracking which subscribers click which tags. After three sends, you have enough data to personalize content without a single survey.
Best practices for reporting and optimization
Great analytics do not mean much without a reporting structure that keeps your team focused on the right numbers. Campaign reporting is an ongoing process, not a monthly snapshot. Building that process well requires a few deliberate choices.
The table below shows how to align your metrics with different business objectives:
Business objective | Metrics to prioritize | Reporting frequency |
Brand awareness | Open rate, CTOR, subscriber growth | Weekly |
Audience engagement | Repeat visit rate, topic affinity, return-to-open rate | Weekly |
Lead generation | CTR, landing page conversion rate, form submissions | Per campaign |
Ecommerce revenue | Email-driven revenue, AOV, repeat purchase rate | Per campaign + monthly |
List health | Bounce rate, spam complaint rate, unsubscribe rate | Weekly |
Once you have your objectives mapped to metrics, the next step is making sure your data is clean enough to trust. Standardized UTM naming conventions are non-negotiable for accurate tracking in GA4 and other analytics platforms. If one team member uses "utm_source=newsletterand another usesutm_source=email_newsletter`, those two campaigns show up as separate traffic sources. Your attribution falls apart before you even begin to analyze it.
Additional practices worth building into your workflow:
Set up automated dashboard reports that run weekly without manual pulls
Use A/B testing on subject lines, send times, and content placement, and let tests run long enough to reach statistical significance
Review unsubscribe trends as a cohort metric, not a single-send metric, to identify content fatigue before it becomes a list health problem
Establish a newsletter media plan at the start of each quarter that ties your KPIs to specific campaign goals
Ongoing analysis using email KPIs like open rate, CTR, and bounce rate is what evolves a newsletter strategy over time. Marketers who treat analytics as a continuous loop, not a post-campaign checklist, are the ones who compound their results quarter over quarter.
My honest take on newsletter analytics
I have worked with enough newsletter campaigns to say this plainly: most marketers are measuring activity, not impact. They watch open rates go up and call it a win. They see a spike in clicks after changing a subject line and declare the strategy is working. But activity and impact are not the same thing, and confusing them is expensive.
The importance of analytics in newsletters is not really about having more data. It is about asking better questions. What did this campaign do for retention? Did it bring back lapsed subscribers? Did it generate purchases from people who had never converted before? Those questions do not get answered by a standard campaign report. They get answered by connecting engagement to revenue through integrated reporting.
The pitfall I see most often is over-optimizing for vanity metrics. A marketer spends weeks testing subject lines to get the open rate from 28% to 34%. Meanwhile, the click-to-conversion rate is 0.4%, and nobody is looking at it. The open rate improvement felt productive. The conversion problem was what actually mattered.
Adopting an analytics-driven mindset means accepting that some of the most important metrics are the ones that take longer to accumulate, cohort retention, CLV, churn probability, and post-click behavior. Those numbers will not look impressive after one campaign. They will look decisive after twelve.
— Media Intercept Team
Take your campaign measurement further with Media Intercept
If you are ready to move beyond basic reporting and start connecting your newsletter campaigns to real audience engagement and measurable outcomes, Media Intercept is built for exactly that. The platform gives brands and publishers access to standardized campaign reporting across premium newsletter inventory, so you are working with clean, consistent data from day one. Whether you are running CPC campaigns and tracking performance at the click level or using CPM placements for predictable reach, every campaign comes with the measurement infrastructure you need to optimize and scale. You can also explore the Media Intercept newsletter advertising guides for deeper research on newsletter analytics and audience engagement strategies. Let’s plan your next campaign together.
FAQ
What is the role of analytics in newsletter campaigns?
Analytics connect campaign-level metrics like open rate and CTR to business outcomes like revenue, subscriber retention, and churn probability. They turn reporting into a decision-making tool rather than a performance summary.
Which metrics matter most beyond open and click rates?
Click-to-open rate, landing page conversion rate, email-driven revenue, and cohort retention are the metrics that reveal whether your newsletter is actually moving the business forward.
How does post-click behavior improve newsletter strategy?
Tracking repeat visits, link re-engagement, and topic affinity after the initial click shows which content builds habitual audience behavior, which is a stronger predictor of subscriber value than first-click activity alone.
Why does UTM parameter consistency matter for newsletter analytics?
Inconsistent UTM naming fragments your traffic data across analytics platforms, making it impossible to accurately attribute revenue or conversions to specific campaigns. Standardized naming is what makes attribution trustworthy.
How often should you review newsletter analytics?
Ongoing analysis using email KPIs should happen at both the campaign level and on a rolling weekly or monthly basis to identify trends, catch deliverability issues early, and refine strategy before problems compound.
Recommended